Enhancing science and health communication with information design and data visualization

A comprehensive approach to information design can transform complex data into accessible knowledge.

Author Kristine Johnson MAMS


In the intricate world of health, medicine, research and policy, the power to distill complexity into clarity is crucial. At Cognition, our mission is to support those who create impact by making their vital work more understandable, engaging and actionable. We empower analysts, researchers and policy teams to drive understanding and achieve measurable results.

To do this, we don’t just simplify data—we transform it into compelling narratives and platforms. Over the years, we’ve seen how effective information design, data visualization, content and user-centered design can transform complex data into accessible knowledge.

Information design for enhancing clear science and public health communication

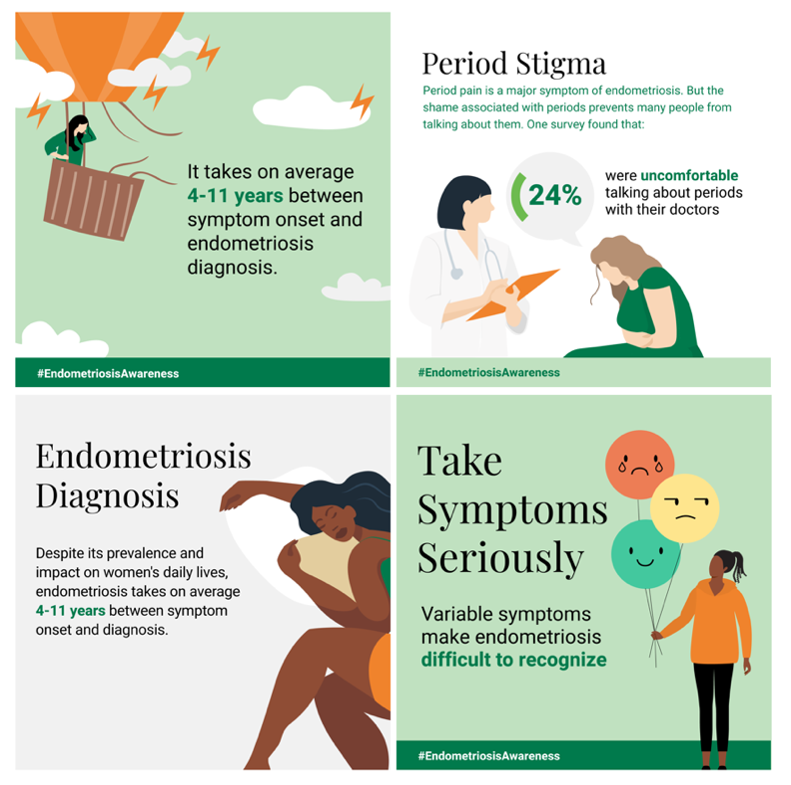
Clear visual communication is crucial in combating misinformation and navigating complex health and scientific information. The objective of using infographics and designing information is to provide a clear, comprehensive overview of the latest research, insights and emerging discussions, ultimately enhancing clinical practice. Infographics, data visualizations, scientific didactics and diagrams are powerful visual tools for communicating complex information, and their effectiveness depends on how well they match the audience’s knowledge and expectations.

Building on behavioral research and cognitive principles, we can design effective visuals for various types of complex information, audiences and settings. Well-designed visuals can effectively convey health and scientific messages to non-experts like investors, journalists, patients and policymakers. They can ensure clarity in comparing options, interpreting results and evaluating risk scenarios, which are common tasks in science and health communication.

For example, in the era of social media, infographics can achieve greater traction and engagement than traditional journal sites. They also play a crucial role in patient recruitment for clinical trials, allowing researchers to tailor their messages to specific patient groups and improve participant diversity.

Infographic series on endometriosis awareness, using illustrations to highlight diagnosis delays, period stigma and symptom recognition
Graph indicating U.S. health spend rising to 16.9% of GDP (1970-2015), outpacing Japan, Germany, U.K., and OECD average

Only once we understand the vision of the project can we successfully render it into reality. We’ve identified five key steps to guide the information design process:

  1. Identify communication challenges.
  2. Establish communication goals.
  3. Use principles to weigh the information effectively.
  4. Design drafts and prototype different executions in context with text.
  5. Evaluate the execution and solutions against user needs and do user testing when possible.

Visualization principles to support proper information interpretation

Of our senses, vision is our primary input for understanding and interpreting visual information, data and scientific pictures. The foundational principles and techniques of information visualization emphasize the importance of understanding human visual perception for effective design. Designers need to master key concepts like pre-attentive processing and Gestalt Laws to improve how visual information and data are comprehended and how it enables decision-making.

Edward Tufte, hailed as a pioneer in information design, proposed key principles for creating effective visualizations. His concept of “graphical excellence” emphasizes clear, precise and efficient presentation of data, focusing on minimizing non-essential elements, or “chart junk,” to avoid distraction. Tufte’s “data-ink ratio” principle advocates using the highest proportion of ink to represent data directly, enhancing clarity and relevance. Although some research suggests visual embellishments can aid memorability, Tufte’s minimalist approach aims for maximum data density and integrity, ensuring truthful and impactful communication.

Two graphs showing how levonorgestrel (LNG) levels affect contraceptive effectiveness
Population pyramid showing age distribution in Bangladesh, with more young people in 2000 and a more even distribution in 2020

Here are some tips:

  • Reduce visual noise: Simplify designs to maintain focus on key information.
  • Prioritize salience: People tend to underestimate important cues and overestimate unimportant ones, which can skew decision-making.
  • Use 2D graphs for accuracy: Although 3D graphs may seem more appealing, 2D graphs are read more accurately and convey information better.
  • Clarify data relationships: People often assume linear relationships in data. Clearly indicate if data is non-linear to avoid misinterpretation, especially with exponential growth.
  • Highlight trend interpretation: Be aware that people interpret upward and downward trends differently, often overestimating downward trends and underestimating upward ones—design with this bias in mind to ensure accurate understanding.

From theory to practice in science and health communication

In information design, clarity is paramount. Poor visuals hinder understanding, so it’s better to avoid them than use low-quality ones. Simple, well-crafted images have immediate, emotional impact, and correcting wrong impressions is difficult.

Effective usability and actionability require visuals that enable audiences to evaluate and synthesize complex information, forming knowledge relationships. By connecting visuals to real-world contexts, designers influence perception and understanding. Thus, designers must ensure a comprehensive approach, incorporating text, images, shapes, spatial arrangements and context for effective information design.

Cognition is uniquely suited to define and translate complex health data, reaching all your intended audiences with equal impact. Ready to tell your story? Lets get started.